Global Sea Surface Temperature continues to droplink
SST UPDATE FROM AMSR-EBy Dr. Roy Spencer, PhD
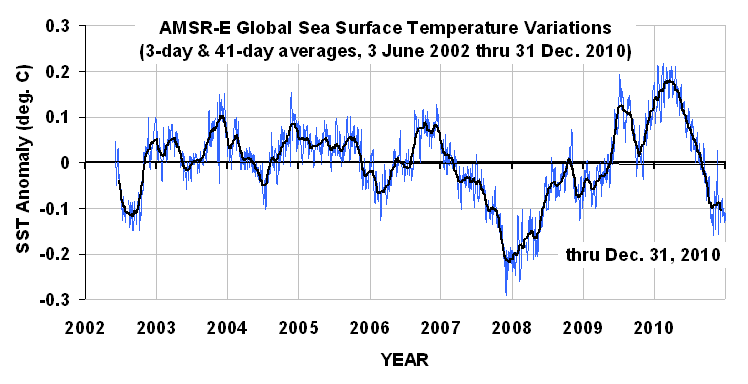
The following plot shows global average sea surface temperatures from the AMSR-E instrument over the lifetime of the Aqua satellite, through Dec 31, 2010. The SSTs at the end of December suggest that the tropospheric temperatures in the previous graph (see post here) still have a ways to fall in the coming months to catch up to the ocean, which should now be approaching its coolest point if it follows the course of previous La Nina’s.

========================================================
Here’s a visual view of the global SST:
2010—where does it fit in the warmest year list? 9,099th link
28 Dec 10 - 1934 has long been considered the warmest year of the past century. A decade ago, the closest challenger appeared to be 1998, a super-el nino year, but it trailed 1934 by 0.54°C (0.97°F).
Since then, NASA GISS has “adjusted” the U.S. data for 1934 downward and 1998 upward (see December 25, 2010 post by Ira Glickstein) in an attempt to make 1998 warmer than 1934 and seemingly erased the original rather large lead of 1934 over 1998. The last phases of the strong 2009-2010 el nino in early 2010 made this year another possible contender for the warmest year of the century.
However, December 2010 has been one of the coldest Decembers in a century in many parts of the world, so 2010 probably won’t be warmer than 1998. But does it really matter? Regardless of which year wins the temperature adjustment battle, how significant will that be? To answer that question, we need to look at a much longer time frame‒centuries and millennia.
The past 10,000 years
Most of the past 10,000 have been warmer than the present. Figure 4 shows temperatures from the GISP2 Greenland ice core. With the exception of a brief warm period about 8,200 years ago, the entire period from 1,500 to 10,500 years ago was significantly warmer than present.
The past 10,000 years
Most of the past 10,000 have been warmer than the present. Figure 4 shows temperatures from the GISP2 Greenland ice core. With the exception of a brief warm period about 8,200 years ago, the entire period from 1,500 to 10,500 years ago was significantly warmer than present.
 |
| Figure 4. Temperatures over the past 10,500 years recorded in the GISP2 Greenland ice core. (Modified from Cuffy and Clow, 1997) |
Another graph of temperatures from the Greenland ice core for the past 10,000 years is shown in Figure 5. It shows essentially the same temperatures as Cuffy and Clow (1997) but with somewhat greater detail. What both of these temperature curves show is that virtually all of the past 10,000 years has been warmer than the present.
 |
| Figure 5. Temperatures over the past 10,000 years recorded in the GISP2 Greenland ice core. |
So where do the 1934/1998/2010 warm years rank in the long-term list of warm years? Of the past 10,500 years, 9,100 were warmer than 1934/1998/2010. Thus, regardless of which year ( 1934, 1998, or 2010) turns out to be the warmest of the past century, that year will rank number 9,099 in the long-term list.
The climate has been warming slowly since the Little Ice Age (Fig. 5), but it has quite a ways to go yet before reaching the temperature levels that persisted for nearly all of the past 10,500 years.
It’s really much to do about nothing.
Dr. Don Easterbrook is a Professor of Geology at Western Washington University in Bellingham, WA. Also see his article "Looming Threat of Global Cooling," which I posted on May 23rd of this year.Poleshift info
Official talk of pole shift MS AGU 2010 Fall Meeting - Press Conference
http://www.youtube.com/watch?v=xrGIt1PDmoQ&feature=mfu_in_order&list=UL
Earthquake hits North Yorkshire
Epicentre of 3.6 magnitude was in the Yorkshire Dales near Ripon with effects being felt as far away as Sunderlandlink

 Full size image of above
No comments:
Post a Comment
Note: only a member of this blog may post a comment.