Cooler times ahead: indicators show deepening La Niño
As shown by the indicators on WUWT’s new ENSO/SST page there is a deeping of the La Niña that is starting to rival 2008 in depth. While it hasn’t yet reached the level of the 2008 event, indications are that it is possible to match or even exceed it.
The graph above from Australia’s BoM took a dip just today, going from last week’s value of approximately -0.9 to -1.4C.
Other NINO index indicators show similar recent drops:


For those unfamiliar with what these index graphics represent, here is a map that shows the regions covered:
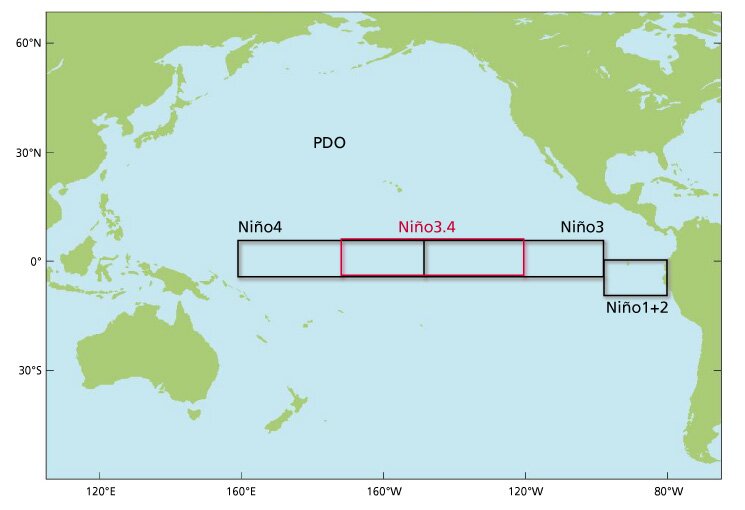
The combined 3.4 index has been deemed a useful metric to gauge El Niño and La Niña events and thus you’ll see it more commonly referenced than the other indices.
Of course a picture is worth a thousand words:

No comments:
Post a Comment
Note: only a member of this blog may post a comment.